Optomed half-year Report, January – June 2023
Optomed Plc Stock Exchange Release 4 August 2023 at 9.00, Helsinki
April – June 2023
- Revenue increased by 0.3 percent to EUR 3.7 (3.7) million.
- Devices segment revenue decreased by 6.5 percent to EUR 1.3 (1.4) million due to a slow quarter of the OEM and Chinese sales channels.
- Software segment revenue increased by 4.2 percent to EUR 2.5 (2.4) million driven by strong healthcare solution sales.
- EBITDA amounted to EUR -0.5 (-0.8) million corresponding to -12.4 (-21.8) percent of revenue, continuing the positive trend from previous quarters.
- After the review period on 3 August 2023 Optomed announced that Juho Himberg will start as Optomed’s CEO 1 October 2023. Previously Juho Himberg has served as the CEO of Aidian (former Orion Diagnostica), a leading point-of-care diagnostics company with innovative products and services for improving the well-being and quality of life for people around the world. Prior to Aidian, Juho has held several leadership positions globally in healthcare and medical technology companies such as Orton, Stryker, C.R. Bard Inc. and Gambro. The CEO transition plan was announced 14 June 2023. Optomed’s current CEO Seppo Kopsala and the Board of Directors have agreed that Kopsala will leave the CEO position once the new CEO is ready to start.
- Outlook unchanged: Optomed expects its full year 2023 revenue to grow compared to 2022.
- Aurora AEYE FDA clearance process: data collection continues.
January – June 2023
- Revenue increased by 4.0 percent to EUR 7.2 (6.9) million.
- Devices segment revenue decreased by 10.9 percent to EUR 2.2 (2.4) million.
- Software segment revenue increased by 11.9 percent to EUR 5.1 (4.5) million.
- Adjusted EBITDA amounted to EUR -976 (-1,750) thousand corresponding to -13.5 (-25.2) percent of revenue.
Key figures
| EUR, thousand | Q2/2023 | Q2/2022 | Change, % | H1/2023 | H1/2022 | Change, % | 2022 |
| Revenue | 3,744 | 3,733 | 0.3% | 7,222 | 6,947 | 4.0% | 14,660 |
| Gross profit * | 2,486 | 2,149 | 15.7% | 4,962 | 4,339 | 14.4% | 10,069 |
| Gross margin % * | 66.4% | 57.6% | 68.7% | 62.4% | 68.7% | ||
| EBITDA | -462 | -813 | 43.1% | -976 | -1,750 | 44.2% | -1,952 |
| EBITDA margin *, % | -12.4% | -21.8% | -13.5% | -25.2% | -13.3% | ||
| Adjusted EBITDA * | -462 | -813 | 43.1% | -976 | -1,750 | 44.2% | -1,952 |
| Adjusted EBITDA margin *, % | -12.4% | -21.8% | -13.5% | -25.2% | -13.3% | ||
| Operating result (EBIT) | -1,009 | -1,355 | 25.5% | -2,052 | -2,815 | 27.1% | -5,097 |
| Operating margin (EBIT) *, % | -27.0% | -36.3% | -28.4% | -40.5% | -34.8% | ||
| Adjusted operating result (EBIT) * | -1,009 | -1,355 | 25.5% | -2,052 | -2,815 | 27.1% | -5,097 |
| Adjusted operating margin (EBIT margin) *, % | -27.0% | -36.3% | -28.4% | -40.5% | -34.8% | ||
| Net profit/ loss | -1,314 | -1,328 | 1.1% | -2,471 | -2,698 | 8.4% | -5,472 |
| Earnings per share | -0.08 | -0.10 | 13.0% | -0.16 | -0.20 | 19.5% | -0.37 |
| Cash flow from operating activities | -468 | -965 | 51.5% | -913 | -1,665 | 45.2% | -2,370 |
| Net Debt | -883 | -825 | 7.1% | -883 | -825 | 7.1 % | -3,251 |
| Net debt/ Adjusted EBITDA (LTM) | 0.7 | 0.2 | 0.7 | 0.2 | 1.7 | ||
| Equity ratio * | 63.6% | 61.5% | 63.6% | 61.5% | 65.0% | ||
| R&D expenses personnel | 362 | 222 | 63.3% | 645 | 598 | 7.9% | 1,198 |
| R&D expenses other costs | 150 | 147 | 2.5% | 313 | 356 | -12.0% | 661 |
| Total R&D expenses | 512 | 368 | 39.1% | 958 | 954 | 0.5% | 1,859 |
*) Alternative performance measures, see section Alternative Performance Measures for definitions and calculations.
CEO Review
Software segment and profitability continues to grow.
The sales growth of Optomed’s Software business unit continued, driven by new healthcare software solution deliveries and increased recurring business. In addition to revenue growth, the Software Segment’s profitability was very good during the review period. Similar to previous quarters, we are highly satisfied with this development, as it enables significant investments in launching new products into the market and expanding into the US market.
The Devices Segment that is currently in a transitional phase, had a relatively quiet quarter, although the gap from the comparison period of the previous year was not as significant as in the previous quarter. Sales of devices under our own brand, particularly through our international distribution channels, showed strong growth once again. However, OEM sales declined significantly compared to the previous year. As a result, the Devices Segment’s sales slightly decreased compared to the comparison period. The trend where the number of devices sold under our own brand grows more than OEM sales in the Devices Segment, continued strongly during the quarter. This shift in trend has recently had a negative impact on revenue development but a positive effect on sales margins.
We are confident that our products are highly competitive and well-positioned in the global market. Our pipeline has expanded, including significant organizational tenders in multiple markets. With these initiatives, we anticipate a return to a growth trajectory for the Device’s segment, driving revenue growth. Currently, our primary focus is on advancing the FDA approval process for the AI fundus camera Aurora AEYE, which is our most significant ongoing project. We are making progress during the review period and are approaching our target. However, until we have official updates to share, we will refrain from providing further comments on this matter. We have a good understanding of the FDA’s expectations and are confident that we can meet them with the ongoing measures we have in place. Additionally, another important project for the company is the completion of the new device development project, which is currently in the CE approval phase.
The company’s profitability and cash flow development continue positively. This is influenced by growing and profitable software sales, Devices segments improving sales margins, significant investment projects in their final stages, and declining fixed costs. Our products are technically excellent and competitive, and the development pipeline for new products is strong. The anticipated FDA clearance for AI fundus camera Aurora AEYE that we are targeting will be an extremely significant breakthrough for the company when it materializes.
I am satisfied with the current situation of the company and optimistic about its future prospects. The company and organization are ready to start the next phase.
Seppo Kopsala
CEO
Outlook 2023
Optomed expects its full year 2023 revenue to grow compared to 2022.
Telephone conference
A telephone conference for analysts, investors and media will be arranged on 4 August 2023 at 11.00 EET, (10.00 CET). The event will be held in English. The presentation material will be available at www.optomed.com/investors 10.00 EET at the latest.
The participants are requested to register for the call-in advance by email to sakari.knuutti@optomed.com.
Please see the call-in numbers below:
FI +358 9 856 263 00
SE +46 8 505 218 52
UK +44 20 3321 5273
US +1 646 838 1719
FR +33 1 70 99 53 92
The conference id is 179 385 659#
Please note that by dialing into the conference call, the participant agrees that personal information such as name and company name will be collected.
Group performance
April – June 2023
In April-June 2023, Group revenue increased by 0.3 percent to EUR 3,744 (3,733) thousand. Devices segment revenue decreased by 6.5 percent to EUR 1,273 (1,361) thousand in spite of strong performance of the global distributor sales as the OEM channel had a slow quarter. The Software segment revenue increased by 4.2 percent to EUR 2,471 (2,372) thousand as the healthcare solution sales continued to perform well.
In April-June 2023, the gross margin increased to 66.4 from 57.6 percent of last year as both segments improved their margins. The increase was mainly driven by the improved profitability of the healthcare solution sales.
EBITDA improved and it was EUR -462 (-813) thousand. The key driver for the improved EBITDA was improved gross profit, however, the OPEX decreased as well.
In April-June 2023, net financial items amounted to EUR -325 (6) thousand and consisted mainly of interest payments to financial institutions and the translation effect of Chinese RMB and USD to EUR.
January – June 2023
In January-June 2023, Group revenue increased by 4.0 percent to EUR 7,222 (6,947) thousand. The growth was driven by the Software segment as the Devices segment’s revenue decreased by 10.9 percent while the Software segment’s revenue increased by 11.9 percent.
The gross margin increased to 68.7 percent from 62.4 percent last year.
EBITDA amounted to EUR -976 (-1,750) thousand and EBIT was EUR -2,052 (-2,815) thousand. The improvement is due to the combination of improved gross profit and decreased OPEX.
Net financial items amounted to EUR -459 (77) thousand and consisted mainly of interest payments to financial institutions and the translation effect of Chinese RMB to EUR.
Cash flow and financial position
April – June 2023
In April-June 2023, the cash flow from operating activities amounted to EUR -468 (-965) thousand. Net cash used in investing activities was EUR -668 (-825) thousand and relates to capitalized development expenses. Net cash from financing activities amounted to EUR -348 (4,208) thousand.
Consolidated cash and cash equivalents at the end of the period amounted to EUR 5,691 (7,097) thousand. Interest-bearing net debt totalled EUR -883 (-825) thousand at the end of the period.
Net working capital was EUR 3,537 (4,239) thousand at the end of the period.
The Chinese customer that Optomed has large due trade receivables from continued to pay as scheduled.
January – June 2023
In January-June 2023, the cash flow from operating activities amounted to EUR -913 (-1,665) thousand.
Net cash used in investing activities was EUR -1,213 (-1,672) thousand and relates to capitalized development expenses.
Net cash from financing activities amounted to EUR -696 (3,595) thousand.
Devices segment
Optomed has two synergistic business segments: Devices and Software.
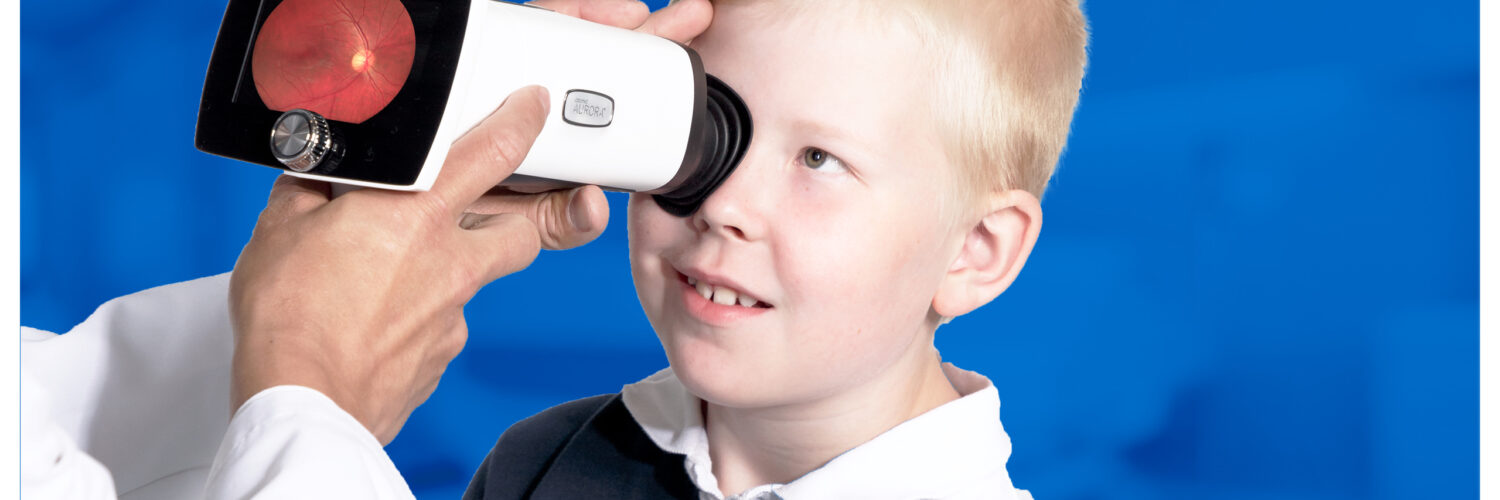
The Devices segment develops, commercializes, and manufactures easy-to-use, and affordable handheld fundus cameras, that are suitable for any clinic for screening of various eye diseases, such as diabetic retinopathy, glaucoma and AMD (Age Related Macular Degeneration).
| EUR, thousand | Q2/2023 | Q2/2022 | Change, % | H1/2023 | H1/2022 | Change, % | 2022 |
| Revenue | 1,273 | 1,361 | -6.5% | 2,161 | 2,425 | -10.9% | 5,398 |
| Gross profit * | 674 | 642 | 5.0% | 1,233 | 1,283 | -3.9% | 3,738 |
| Gross margin % * | 53.0% | 47.2% | 57.0% | 52.9 % | 69.3% | ||
| EBITDA | -217 | -464 | 53.2% | -643 | -963 | 33.2% | -670 |
| EBITDA margin *, % | -17.1% | -34.1% | -29.8% | -39.7 % | -12.4% | ||
| Operating result (EBIT) | -578 | -843 | 31.5% | -1,356 | -1,707 | 20.5% | -3,159 |
| Operating margin (EBIT) *, % | -45.4% | -61.9% | -62.8% | -70.4 % | -58.5% |
*) Alternative performance measures, see section Alternative Performance Measures for definitions and calculations.
April-June 2023
In April-June 2023, the Devices segment revenue decreased by 6.5 percent to EUR 1,273 (1,361) thousand due to softness of the OEM channel. The global distributor sales continued to perform well.
The gross margin was 53.0 (47.2) percent. EBITDA was EUR -217 (-464) thousand or -17.1 (-34.1) percent of revenue. During the quarter, Optomed took actions to reduce operating costs especially in the support functions affecting both the Devices segment and the group functions.
January-June 2023
In January-June 2023, the Devices segment revenue decreased by 10.9 percent to EUR 2,161 (2,425) thousand.
The gross margin increased to 57.0 percent from 52.9 percent as the share of higher gross margin global distributor sales has increased compared to lower margin OEM sales.
EBITDA was EUR -643 (-963) thousand or -29.8 (-39.7) percent of revenue.
Software segment
Optomed has two synergistic business segments: Devices and Software.
The Software segment develops and commercializes screening software for diabetic retinopathy and cancer screening for healthcare organizations. The segment also distributes off-the-shelf products from selected partners to supplement its own solutions and expertise and provides software consultation to support the Devices segment screening solution projects.
| EUR, thousand | Q2/2023 | Q2/2022 | Change, % | H1/2023 | H1/2022 | Change, % | 2022 |
| Revenue | 2,471 | 2,372 | 4.2% | 5,061 | 4,522 | 11.9% | 9,263 |
| Gross profit * | 1,812 | 1,507 | 20.2% | 3,729 | 3,056 | 22.0% | 6,330 |
| Gross margin % * | 73.3% | 63.5% | 73.7% | 67.6% | 68.3% | ||
| EBITDA | 578 | 478 | 20.7% | 1,368 | 898 | 52.2% | 2,079 |
| EBITDA margin *, % | 23.4% | 20.2% | 27.0% | 19.9% | 22.4% | ||
| Operating result (EBIT) | 393 | 317 | 24.2% | 1,009 | 580 | 74.0% | 1,431 |
| Operating margin (EBIT) *, % | 15.9% | 13.3% | 19.9% | 12.8% | 15.4% |
*) Alternative performance measures, see section Alternative Performance Measures for definitions and calculations.
April – June 2023
In April-June 2023, the Software segment revenue increased by 4.2 percent to EUR 2,471 (2,372) thousand as the healthcare solutions business continued on its growth track.
The profitability improved due to good performance of the healthcare solution sales. Gross margin increased and was 73.3 (63.5) percent. EBITDA was EUR 578 (478) thousand or 23.4 (20.2) percent of revenue.
January – June 2023
In January-June 2023, the Software segment revenue increased by 11.9 percent to EUR 5,061 (4,522) thousand.
Gross margin increased and it was 73.3 (63.5) percent. EBITDA was EUR 1,368 (898) thousand or 27.0 (19.9) percent of revenue. The increased profitability was driven by improved performance of the healthcare solution sales.
Group-wide expenses
Group-wide expenses relate to functions supporting the entire group such as treasury, group accounting, marketing, legal, HR, and IT.
April – June 2023
Group-wide operating expenses amounted to EUR 823 (827) thousand.
January – June 2023
Group-wide operating expenses amounted to EUR 1,700 (1,685) thousand.
Personnel
Number of personnel at the end of the reporting period.
| 6/2023 | 6/2022 | |
| Devices | 47 | 55 |
| Software | 46 | 43 |
| Group common | 22 | 22 |
| Total | 115 | 120 |
Corporate Governance
Optomed complies with Finnish laws and regulations, Optomed’s Articles of Association, the rules of Nasdaq Helsinki and the Finnish Corporate Governance Code 2020 issued by the Securities Market Association of Finland. The code is publicly available at http://cgfinland.fi/en/. Optomed’s corporate governance statement 2022 is available on the company website www.optomed.com/investors/.
Annual General Meeting
The Annual General Meeting held on 10 May 2023 adopted the financial statements for the financial period ended on 31 December 2022 and discharged the members of the Board of Directors and the CEO from liability for the financial period ended on 31 December 2022. The Annual General Meeting decided to reject the remuneration report for governing bodies. The decision made is advisory.
The Annual General Meeting resolved in accordance with the proposal of the Board of Directors that no dividend will be paid for the year 2022.
The number of members of the Board of Directors was confirmed as six. Seppo Mäkinen, Petri Salonen, Reijo Tauriainen and Anna Tenstam were re-elected as members of the Board and Catherine Calarco and Ty Lee were elected as new members of the Board.
The Annual General Meeting confirmed the annual Board remuneration as follows:
- Chairman of the Board EUR 36,000
- members of the Board EUR 18,000.
In addition, a meeting fee in the amount of EUR 300 is paid to the Chairpersons and EUR 200 to members of the Committees for each Committee meeting. 40 percent of the Board remuneration is paid in Optomed shares and 60 percent in cash. The remuneration will be paid once a year in August, after Optomed’s H1 report has been announced.
The Annual General Meeting decided to re-elect KPMG Oy Ab, a firm of authorized public accountants, as the Company’s auditor. KPMG Oy Ab has informed the Company that Authorized Public Accountant Heidi Hyry acts as the auditor with principal responsibility. Auditor’s remuneration will be paid in accordance with an invoice approved by the Company.
The Annual General Meeting approved the authorization for the Board of Directors to repurchase Optomed’s own shares and to accept them as pledge. Altogether no more than 1,654,135 shares may be repurchased or accepted as pledge. The authorization will be valid until the earlier of the end of the next Annual General Meeting or 18 months from the resolution of the Annual General Meeting.
The Annual General Meeting authorized the Board of Directors to decide on the issuance of shares and other special rights entitling to shares referred to in Chapter 10, Section 1 of the Finnish Companies Act. The number of shares to be issued based on this authorization may not exceed 1,654,135. The Board of Directors is authorized to resolve on all terms and conditions of the issuance of shares and special rights entitling to shares, including the right to derogate from the pre-emptive right of the shareholders. The authorization will be valid until the earlier of the end of the next Annual General Meeting or 18 months from the resolution of the Annual General Meeting.
The Annual General Meeting decided to amend the Articles of Association so that the minimum number of the members of the Board of Directors was reduced from five members to four.
Decisions of the Board of Directors:
At its meeting held after the Annual General Meeting, the Board of Directors elected from among its members Petri Salonen as its Chairman. The committee members were elected as follows:
Audit Committee:
- Reijo Tauriainen (Chairman)
- Catherine Calarco
- Anna Tenstam
Remuneration Committee:
- Seppo Mäkinen (Chairman)
- Catherine Calarco
- Ty Lee
Shares and shareholders
The Company has one share series with all shares having the same rights. At the end of the review period Optomed Plc’s share capital consisted of 16,541,355 shares and the Company held 370,066 shares in the treasury which approximately corresponds to 2.3 percent of the total amount of the shares and votes. Additional information with respect to the shares, shareholding and trading can be found on the Company’s website www.optomed.com/investors/.
Risks and uncertainties
The key risks and uncertainties are described in the company’s Annual Report 2022 which was published on 2 March 2023. The complete report is available at https://www.optomed.com/investors/. The risk position of Optomed has not changed since then.
Flagging notifications
5 June 2023 Cenova Capital notified that its total holdings in Optomed shares and votes has decreased to 9.96% of all of the registered shares in Optomed.
Audit review
This financial report has not been audited by the company’s auditors.
Financial reporting in 2023
- 3 November 2023 Interim Report for 1 January – 30 September 2023
For more information, contact
Sakari Knuutti, CFO
Tel: +358 (0)50 562 4077
E-mail: sakari.knuutti@optomed.com
Seppo Kopsala, CEO
Tel: +358 (0)40 555 1050
E-mail: seppo.kopsala@optomed.com
About Optomed
Optomed is a Finnish medical technology company and one of the leading providers of handheld fundus cameras and screening software. Optomed combines handheld screening devices with software and artificial intelligence with the aim to transform the diagnostic process of blinding eye-diseases such as rapidly increasing diabetic retinopathy. In its business Optomed focuses on eye-screening devices and software solutions related R&D in Finland and sales through different channels in over 60 countries.
Alternative Performance Measures
Optomed uses certain alternative performance measures (APMs) with the purpose to provide a better understanding of how the business develops. These APMs, as defined, cannot be fully compared with other companies’ APMs.
| Alternative Performance Measures | Definition |
| Gross profit | Revenue + Other operating income – Materials and services expenses |
| Gross margin, % | Gross profit / Revenue |
| EBITDA | Operating result before depreciation, amortization and impairment losses |
| EBITDA margin, % | EBITDA / Revenue |
| Operating result | Profit/loss after depreciation, amortization and impairment losses |
| Operating margin, % | Operating result / Revenue |
| Adjusted operating result | Operating result excluding items affecting comparability |
| Adjusted operating margin, % | Adjusted operating result / Revenue |
| Adjusted EBITDA | EBITDA excluding items affecting comparability |
| Adjusted EBITDA margin, % | Adjusted EBITDA / Revenue |
| Items affecting comparability | Material items outside ordinary course of business including restructuring costs, net gains or losses from sale of business operations or other non-current assets, strategic development projects, external advisory costs related to capital reorganisation, impairment charges on non-current assets incurred in connection with restructurings, compensation for damages and transaction costs related to business acquisitions. |
| Net Debt | Interest-bearing liabilities (borrowings from financial institutions, government loans and subordinated loans) – cash and cash equivalents (excl. lease liabilities according to IFRS 16) |
| Net Debt / Adjusted EBITDA (LTM), times | Net Debt / Adjusted EBITDA (for the last twelve months, LTM) |
| Earnings per share | Net result / Weighted average number of outstanding shares |
| Equity ratio, % | Total equity / Total assets |
| R&D expenses | Employee benefit expenses for R&D personnel and other operational expenses related to R&D activities |
Consolidated income statement
| In thousands of euro | Q2/2023 | Q2/2022 | H1/2023 | H1/2022 | 2022 | ||||
| Revenue | 3,744 | 3,733 | 7,222 | 6,947 | 14,660 | ||||
| Other operating income | 34 | 0 | 34 | 37 | 857 | ||||
| Materials and services | -1,292 | -1,584 | -2,294 | -2,645 | -5,449 | ||||
| Employee benefit expenses | -2,190 | -2,124 | -4,382 | -4,367 | -8,827 | ||||
| Depreciation, amortization and Impairment losses | -547 | -542 | -1,076 | -1,066 | -3,145 | ||||
| Other operating expenses | -758 | -838 | -1,556 | -1,722 | -3,193 | ||||
| Operating result | -1,009 | -1,355 | -2,052 | -2,815 | -5,097 | ||||
| Finance income | 38 | 302 | 106 | 418 | 569 | ||||
| Finance expenses | -363 | -296 | -565 | -340 | -1,024 | ||||
| Net finance expenses | -325 | 6 | -459 | 77 | -454 | ||||
| Profit (loss) before income taxes | -1,334 | -1,348 | -2,511 | -2,738 | -5,551 | ||||
| Income tax expense | 20 | 20 | 40 | 39 | 79 | ||||
| Loss for the period | -1,314 | -1,328 | -2,471 | -2,698 | -5,472 | ||||
| Loss for the period attributable to | |||||||||
| Owners of the parent company | -1,314 | -1,328 | -2,471 | -2,698 | -5,472 | ||||
| Loss per share attributable to owners of the parent company |
|||||||||
| Weighted average number of shares | 15,691,727 | 13,797,968 | 15,691,727 | 13,797,968 | 14,640,697 | ||||
| Basic loss per share (euro) | -0.08 | -0.10 | -0.16 | -0.20 | -0.37 | ||||
Consolidated condensed comprehensive income statement
| In thousands of euro | Q2/2023 | Q2/2022 | H1/2023 | H1/2022 | 2022 |
| Loss for the period | -1,314 | -1,328 | -2,471 | -2,698 | -5,472 |
| Other comprehensive income | |||||
| Foreign currency translation difference | 166 | -43 | 244 | -120 | 139 |
| Other comprehensive income, net of tax | 166 | -43 | 244 | -120 | 139 |
| Total comprehensive loss attributable to Owners of the parent company | -1,148 | -1,372 | -2,227 | -2,818 | -5,333 |
Consolidated balance sheet
| In thousands of euro | June 30, 2023 | June 30, 2022 | Dec 31, 2022 |
| ASSETS | |||
| Non-current assets | |||
| Goodwill | 4,256 | 4,256 | 4,256 |
| Development costs | 7,200 | 7,115 | 6,562 |
| Customer relationships | 1,053 | 1,275 | 1,164 |
| Technology | 483 | 585 | 534 |
| Other intangible assets | 381 | 355 | 379 |
| Total intangible assets | 13,374 | 13,586 | 12,895 |
| Tangible assets | 769 | 664 | 852 |
| Right-of-use assets | 1,231 | 1,029 | 1,448 |
| Deferred tax assets | 17 | 14 | 15 |
| Total non-current assets | 15,391 | 15,293 | 15,210 |
| Current assets | |||
| Inventories | 2,954 | 3,161 | 2,998 |
| Trade and other receivables | 4,590 | 5,190 | 4,568 |
| Cash and cash equivalents | 5,691 | 7,079 | 8,524 |
| Total current assets | 13,235 | 15,429 | 16,090 |
| Total assets | 28,627 | 30,722 | 31,300 |
| In thousands of euro | June 30, 2023 | June 30, 2022 | Dec 31, 2022 |
| EQUITY | |||
| Share capital | 80 | 80 | 80 |
| Share premium | 504 | 504 | 504 |
| Reserve for invested non-restricted equity | 46,912 | 43,089 | 46,896 |
| Translation differences | 296 | -207 | 51 |
| Retained earnings | -27,117 | -21,879 | -21,717 |
| Profit (loss) for the financial year | -2,471 | -2,698 | -5,472 |
| Total equity | 18,203 | 18,888 | 20,342 |
| LIABILITIES | |||
| Non-current liabilities | |||
| Borrowings from financial institutions | 2,983 | 3,822 | 3,380 |
| Government loans | 837 | 1,871 | 906 |
| Lease liabilities | 744 | 640 | 1,058 |
| Deferred tax liabilities | 349 | 425 | 387 |
| Total Non-current liabilities | 4,913 | 6,758 | 5,731 |
| Current liabilities | |||
| Borrowings from financial institutions | 794 | 368 | 794 |
| Government loans | 193 | 193 | 193 |
| Lease liabilities | 515 | 405 | 412 |
| Trade and other payables | 4,008 | 4,112 | 3,828 |
| Total current liabilities | 5,510 | 5,077 | 5,227 |
| Total liabilities | 10,423 | 11,835 | 10,957 |
| Total equity and liabilities | 28,627 | 30,722 | 31,300 |
Consolidated statement of changes in shareholders’ equity
Equity attributable to owners of the parent company
| In thousands of euro | Share capital | Share premium | Reserve for invested non-restricted equity | Translation differences | Retained earnings | Total |
| Balance at January 1, 2023 | 80 | 504 | 46,896 | 51 | -27,189 | 20,342 |
| Comprehensive income | ||||||
| Loss for the period | -2,471 | -2,471 | ||||
| Other comprehensive income | ||||||
| Translation differences | 244 | 244 | ||||
| Total comprehensive income for the period | 244 | -2,471 | -2,227 | |||
| Share options | 16 | 72 | 88 | |||
| Total transactions with owners of the company | 16 | 72 | 88 | |||
| Balance at June 30, 2023 | 80 | 504 | 46,912 | 296 | -29,588 | 18,203 |
Equity attributable to owners of the parent company
| In thousands of euro | Share capital | Share premium | Reserve for invested non-restricted equity | Translation differences | Retained earnings | Total |
| Balance at January 1, 2022 | 80 | 504 | 38,526 | -88 | -21,970 | 17,052 |
| Comprehensive income | ||||||
| Loss for the period | -2,698 | -2,698 | ||||
| Other comprehensive income | ||||||
| Translation differences | -120 | -120 | ||||
| Total comprehensive income for the period | -120 | -2,698 | -2,818 | |||
| Share options | 4,563 | 91 | 4,654 | |||
| Total transactions with owners of the company | 4,563 | 91 | 4,654 | |||
| Other adjustments | 0 | |||||
| Balance at June 30, 2022 | 80 | 504 | 43,089 | -207 | -24,577 | 18,888 |
Equity attributable to owners of the parent company
| In thousands of euro | Share capital | Share premium | Reserve for invested non-restricted equity | Translation differences | Retained earnings | Total |
| Balance at January 1, 2022 | 80 | 504 | 38,526 | -88 | -21,970 | 17,052 |
| Comprehensive income | ||||||
| Loss for the period | -5,472 | -5,472 | ||||
| Other comprehensive income | ||||||
| Translation differences | 139 | 139 | ||||
| Total comprehensive income for the period | 139 | -5,472 | -5,333 | |||
| Share issue | 8,371 | 8,371 | ||||
| Share options | 253 | 253 | ||||
| Total transactions with owners of the company | 8,371 | 253 | 8,624 | |||
| Balance at December 31, 2022 | 80 | 504 | 46,896 | 51 | -27,189 | 20,342 |
Consolidated cash flow statement
| In thousands of euro | Q2/2023 | Q2/2022 | H1/2023 | H1/2022 | 2022 |
| Cash flows from operating activities | |||||
| Loss for the financial year | -1,314 | -1,328 | -2,471 | -2,698 | -5,472 |
| Adjustments: | |||||
| Depreciation, amortization and impairment
losses |
547 | 542 | 1,076 | 1,066 | 3,145 |
| Finance income and finance expenses | 333 | 403 | 470 | 330 | 618 |
| Other adjustments | -44 | 15 | -55 | 30 | -770 |
| Cash flows before change in net working capital | -479 | -369 | -980 | -1,273 | -2,479 |
| Change in net working capital: | |||||
| Change in trade and other receivables
(increase (-) / decrease (+)) |
-252 | -872 | -21 | -438 | 204 |
| Change in inventories
(increase (-) / decrease (+)) |
82 | 115 | -14 | -184 | -68 |
| Change in trade and other payables
(increase (+) / decrease (-)) |
223 | 568 | 139 | 671 | 172 |
| Cash flows before finance items | -426 | -557 | -875 | -1,223 | -2,171 |
| Interest paid | -34 | -10 | -52 | -22 | -76 |
| Other finance expenses paid | -7 | -398 | 13 | -420 | -123 |
| Interest received | 0 | 0 | 0 | 0 | 0 |
| Net cash from operating activities (A) | -468 | -965 | -913 | -1,665 | -2,370 |
| Cash flows from investing activities | |||||
| Capitalization of development expenses | -606 | -750 | -1,124 | -1,281 | -2,249 |
| Acquisition of tangible assets | -62 | -75 | -89 | -391 | -780 |
| Net cash used in investing activities (B) | -668 | -825 | -1,213 | -1,672 | -3,029 |
| Cash flows from financing activities | |||||
| Proceeds from share subscriptions | 12 | 4,892 | 16 | 4,945 | 9,012 |
| Share issue transaction costs | 0 | -382 | 0 | -382 | -682 |
| Proceeds from loans and borrowings | 0 | 14 | 0 | 14 | 0 |
| Repayment of loans and borrowings | -235 | -213 | -465 | -778 | -912 |
| Repayment of lease liabilities | -125 | -103 | -247 | -205 | -415 |
| Net cash from financing activities (C) | -348 | 4,208 | -696 | 3,595 | 7,003 |
| Net cash from (used in) operating, investing and financing activities (A+B+C) | -1,483 | 2,418 | -2,822 | 257 | 1,605 |
| Cash and cash equivalents at beginning of period | 7,179 | 4,630 | 8,524 | 6,804 | 6,804 |
| Effect of movements in exchange rate on cash held | -5 | 31 | -11 | 17 | 115 |
| Cash and cash equivalents at end of period | 5,691 | 7,079 | 5,691 | 7,079 | 8,524 |
Selected notes
Corporate information and basis of accounting
Corporate information
Optomed is a Finnish medical technology group (hereafter ‘Optomed’ or ‘Group’) that specialises in handheld fundus cameras and solutions for screening of blinding eye diseases, established in 2004.
The Group’s parent company, Optomed Plc (hereafter the ‘Company’), is a Finnish public limited liability company established under the laws of Finland, and its business ID is 1936446-1. It is domiciled in Oulu, Finland and the Company’s registered address is Yrttipellontie 1, 90230 Oulu, Finland.
All presented figures have been rounded so the sum of the individual figures may differ from the presented total figure.
This report has been authorized for issue by the company`s board of directors.
The preparation of financial statements under IFRS requires management to make judgments, estimates and assumptions that affect the reported amounts of assets and liabilities, and disclosure of contingent assets and liabilities at the end of the reporting period as well as the reported amounts of income and expenses during the reporting period. These estimates and assumptions are based on historical experience and other justified assumptions, such as future expectations, that Optomed management believes are reasonable under the circumstances at the end of the reporting period and the time when they were made.
Although these estimates are based on management’s best knowledge of current events and actions, actual results may ultimately differ from those estimates. The estimates and underlying assumptions are reviewed on an on-going basis and when preparing financial statements. Changes in accounting estimates may be necessary if there are changes in the circumstances on which the estimate was based, or as a result of new information or more experience. Such changes are recognized in the period in which the estimate or the assumption is revised.
Use of judgment and estimates
Judgements that management has made in the process of applying accounting policies and that have the most significant effect on the amounts recognised in the financial statements, relate to the following areas:
— Determining trade receivables credit risk
— capitalisation of development costs: determination of development expenditure eligible for capitalisation
— impairment testing of development expenditures
Reportable segments
Q2/2023
| In thousands of euro | Devices | Software | Group
Admin |
Total |
| External revenue | 1,273 | 2,471 | 0 | 3,744 |
| Net operating expenses | -599 | -659 | 0 | -1,258 |
| Margin | 674 | 1,812 | 0 | 2,486 |
| Depreciation and amortization | -360 | -184 | -2 | -547 |
| Other expenses | -891 | -1,234 | -823 | -2,948 |
| Operating result | -578 | 393 | -825 | -1,009 |
| Finance items | 0 | 0 | -325 | -325 |
| Loss before tax expense | -578 | 393 | -1,149 | -1,334 |
Q2/2022
| In thousands of euro | Devices | Software | Group
Admin |
Total |
| External revenue | 1,361 | 2,372 | 0 | 3,733 |
| Net operating expenses | -719 | -865 | 0 | -1,584 |
| Margin | 642 | 1,507 | 0 | 2,149 |
| Depreciation and amortization | -378 | -162 | -2 | -542 |
| Other expenses | -1,106 | -1,029 | -827 | -2,961 |
| Operating result | -843 | 317 | -829 | -1,355 |
| Finance items | 0 | 0 | 6 | 6 |
| Loss before tax expense | -843 | 317 | -822 | -1,348 |
H1/2023
| In thousands of euro | Devices | Software | Group
Admin |
Total |
| External revenue | 2,161 | 5,061 | 0 | 7,222 |
| Net operating expenses | -928 | -1,332 | 0 | -2,260 |
| Margin | 1,233 | 3,729 | 0 | 4,962 |
| Depreciation and amortization | -713 | -359 | -4 | -1,076 |
| Other expenses | -1,876 | -2,362 | -1,700 | -5,938 |
| Operating result | -1,356 | 1,009 | -1,704 | -2,052 |
| Finance items | 0 | 0 | -459 | -459 |
| Loss before tax expense | -1,356 | 1,009 | -2,163 | -2,511 |
H1/2022
| In thousands of euro | Devices | Software | Group
Admin |
Total |
| External revenue | 2,425 | 4,522 | 0 | 6,947 |
| Net operating expenses | -1,143 | -1,466 | 0 | -2,609 |
| Margin | 1,283 | 3,056 | 0 | 4,339 |
| Depreciation and amortization | -743 | -319 | -4 | -1,066 |
| Other expenses | -2,246 | -2,158 | -1,685 | -6,088 |
| Operating result | -1,707 | 580 | -1,689 | -2,815 |
| Finance items | 0 | 0 | 77 | 77 |
| Loss before tax expense | -1,707 | 580 | -1,611 | -2,738 |
2022
| In thousands of euro | Devices | Software | Group
Admin |
Total |
| External revenue | 5,398 | 9,263 | 0 | 14,660 |
| Net operating expenses | -1,659 | -2,933 | 0 | -4,592 |
| Margin | 3,738 | 6,330 | 0 | 10,069 |
| Depreciation and amortization | -2,489 | -649 | -8 | -3,145 |
| Other expenses | -4,408 | -4,251 | -3,361 | -12,020 |
| Operating result | -3,159 | 1,431 | -3,368 | -5,097 |
| Finance items | 0 | 0 | -454 | -454 |
| Loss before tax expense | -3,159 | 1,431 | -3,823 | -5,551 |
Revenue
| In thousands of euro | Q2/2023 | Q2/2022 | H1/2023 | H1/2022 | 2022 |
| Finland | 2,391 | 2,066 | 4,911 | 4,172 | 8,606 |
| Rest of the Europe | 234 | 682 | 470 | 997 | 1,715 |
| Rest of the World | 1,119 | 985 | 1,841 | 1,778 | 4,340 |
| Total | 3,744 | 3,733 | 7,222 | 6,947 | 14,660 |
Other operating income
| In thousands of euro | Q2/2023 | Q2/2022 | H1/2023 | H1/2022 | 2022 | |
| Other operating income | 34 | 0 | 34 | 37 | 857 | |
| Total | 34 | 0 | 34 | 37 | 857 | |
Other operating expenses
| Other operating expenses | Q2/2023 | Q2/2022 | H1/2023 | H1/2022 | 2022 |
| Sales and marketing | -192 | -204 | -339 | -378 | -784 |
| Research and development | -43 | -82 | -132 | -263 | -361 |
| General and administration | -523 | -551 | -1,085 | -1,081 | -2,049 |
| Total operating expenses | -758 | -838 | -1,556 | -1,722 | -3,193 |
Other operating expenses also comprise changes in expected credit losses and realized credit losses.
Tangible assets
| In thousands of euro | Machinery and equipment 30.6.2023 | Machinery and equipment 30.6.2022 | Machinery and
equipment 31.12.2022 |
| Cost | |||
| Balance at January 1 | 3,512 | 2,721 | 2,721 |
| Additions | 88 | 405 | 791 |
| Balance at End of Period | 3,600 | 3,126 | 3,512 |
| Accumulated depreciation and impairment losses | |||
| Balance at January 1 | -2,660 | -2,288 | -2,288 |
| Depreciation | -170 | -174 | -372 |
| Balance at end of period | -2,830 | -2,462 | -2,660 |
| Carrying amount at January 1 | 852 | 433 | 433 |
| Carrying amount at June 30/ December 31 | 769 | 664 | 852 |
Leases
Leased tangible assets
| In thousands of euro | 30.6.2023 | 30.6.2022 | 2022 | ||
| Additions to right-of-use assets | 280 | 35 | 671 | ||
| Depreciation change for right-of-use assets | -253 | -211 | -428 | ||
| Carrying amount at the end of the reporting period | 1,231 | 1,029 | 1,448 | ||
| Leased tangible assets comprise business premises and are presented as a separate line item Right-of-use assets in the consolidated balance sheet. | |||||
Lease liabilities |
|||||
| In thousands of euro | 30.6.2023 | 30.6.2022 | 2022 | ||
| Current | 515 | 405 | 412 | ||
| Non-current | 744 | 640 | 1,058 | ||
| Total | 1,260 | 1,044 | 1,470 | ||
The above liabilities are presented on the line item Lease liabilities (non-current / current) in the consolidated balance sheet, based on their maturity.
Intangible assets and goodwill
30.06.2023
| In thousands of euro | Goodwill | Development costs | Customer relationships | Technology | Other intangible assets | Total |
| Cost | ||||||
| Balance at January 1 | 4,256 | 13,978 | 2,222 | 1,023 | 1,054 | 22,533 |
| Additions | 0 | 1,099 | 0 | 0 | 33 | 1,132 |
| Balance at June 30 | 4,256 | 15,077 | 2,222 | 1,023 | 1,087 | 23,665 |
| Accumulated amortization and impairment losses | ||||||
| Balance at January 1 | 0 | -7,416 | -1,057 | -489 | -676 | -9,638 |
| Amortization | 0 | -461 | -112 | -51 | -30 | -653 |
| Balance at June 30 | 0 | -7,877 | -1,169 | -540 | -706 | -10,291 |
| Carrying amount at January 1 | 4,256 | 6,562 | 1,164 | 534 | 379 | 12,895 |
| Carrying amount at June 30 | 4,256 | 7,200 | 1,053 | 483 | 381 | 13,374 |
30.06.2022
| In thousands of euro | Goodwill | Development costs | Customer relationships | Technology | Other intangible assets | Total |
| Cost | ||||||
| Balance at January 1 | 4,256 | 11,815 | 2,222 | 1,023 | 951 | 20,267 |
| Additions | 0 | 1,245 | 0 | 0 | 48 | 1,293 |
| Balance at June 30 | 4,256 | 13,060 | 2,222 | 1,023 | 999 | 21,560 |
| Accumulated amortization and impairment losses | ||||||
| Balance at January 1 | 0 | -5,477 | -836 | -387 | -593 | -7,292 |
| Amortization | 0 | -468 | -111 | -51 | -51 | -681 |
| Balance at June 30 | 0 | -5,945 | -947 | -438 | -644 | -7,973 |
| – | ||||||
| Carrying amount at January 1 | 4,256 | 6,338 | 1,386 | 636 | 358 | 12,975 |
| Carrying amount at June 30 | 4,256 | 7,115 | 1,275 | 585 | 355 | 13,586 |
31.12.2022
| In thousands of euro | Goodwill | Development costs | Customer relationships | Technology | Other intangible assets | Total |
| Cost | ||||||
| Balance at January 1 | 4,256 | 11,815 | 2,222 | 1,023 | 951 | 20,267 |
| Additions | 0 | 2,163 | 0 | 0 | 103 | 2,266 |
| Balance at December 31 | 4,256 | 13,978 | 2,222 | 1,023 | 1,054 | 22,533 |
| Accumulated amortization and impairment losses | – | |||||
| Balance at January 1 | 0 | -5,477 | -836 | -387 | -593 | -7,292 |
| Amortization | 0 | -899 | -222 | -102 | -83 | -1,306 |
| Impairment losses | 0 | -1,040 | 0 | 0 | 0 | -1,040 |
| Balance at December 31 | 0 | -7,416 | -1,057 | -489 | -676 | -9,638 |
| – | ||||||
| Carrying amount at January 1 | 4,256 | 6,338 | 1,386 | 636 | 358 | 12,975 |
| Carrying amount at December 31 | 4,256 | 6,562 | 1,164 | 534 | 379 | 12,895 |
Financial assets
Carrying amounts – at amortized cost
| In thousands of euro | 30.6.2023 | 30.6.2022 | 31.12.2022 |
| Trade receivables | |||
| Recourse factoring | 0 | 358 | 324 |
| Other trade receivables | 3,442 | 3,673 | 3,232 |
| Total trade receivables | 3,442 | 4,031 | 3,556 |
| Cash and cash equivalents | 5,691 | 7,079 | 8,524 |
| Total | 9,133 | 11,109 | 12,080 |
Due to overdue trade receivables, financial assets are subject to an increased risk of credit loss.
Exposure to credit risk and loss allowance
Optomed considers it has heightened risk regarding Chinese customer’s trade receivables. The credit risk concentration has been formed and is associated with an increased credit loss risk due to overdue trade receivables. Chinese customer has paid its overdue receivables according to planned schedule.
| In thousands of euro | Gross carrying amount | Weighted av.
loss rate% |
Loss
allowance |
| At June 30, 2023 | |||
| Current (not past due) | 1,877 | 0.5% | 9 |
| Past due | |||
| 1-30 days | 170 | 1.5% | 3 |
| 31-60 days | 35 | 4% | 1 |
| 61-90 days | 8 | 9% | 1 |
| More than 90 days past due | 279 | 12% | 33 |
| Specific loss allowance | 1,600 | 30% | 480 |
| Total | 3,970 | 528 |
| In thousands of euro | Gross carrying amount | Weighted av.
loss rate% |
Loss
allowance |
| At June 30, 2022 | |||
| Current (not past due) | 1,800 | 0.5% | 9 |
| Past due | |||
| 1-30 days | 172 | 1.5% | 3 |
| 31-60 days | 45 | 4% | 2 |
| 61-90 days | 11 | 9% | 1 |
| More than 90 days past due | 30 | 12% | 4 |
| Specific loss allowance | 2,332 | 30% | 700 |
| Total | 4,391 | 718 |
| In thousands of euro | Gross carrying amount | Weighted av.
loss rate% |
Loss
allowance |
| At December 31, 2022 | |||
| Current (not past due) | 1,664 | 0.5% | 8 |
| Past due | |||
| 1-30 days | 161 | 1.5% | 2 |
| 31-60 days | 7 | 4% | 0 |
| 61-90 days | 29 | 9% | 3 |
| More than 90 days past due | 12 | 12% | 1 |
| Specific loss allowance | 1,962 | 30% | 589 |
| Total | 3,836 | 604 |
Financial liabilities
| In thousands of euro | 30.6.2023 | 30.6.2022 | 31.12.2022 | ||
| Non-current financial liabilities | |||||
| Borrowings from financial institutions | 2,983 | 3,822 | 3,380 | ||
| Government loans | 837 | 1,871 | 906 | ||
| Lease liabilities | 744 | 640 | 1,058 | ||
| Total | 4,565 | 6,333 | 5,344 | ||
|
|
|||||
| Current financial liabilities | |||||
| Borrowings from financial institutions | 794 | 368 | 794 | ||
| Government loans | 193 | 193 | 193 | ||
| Lease liabilities | 515 | 405 | 412 | ||
| Trade payables | 785 | 1,159 | 869 | ||
| Total | 2,287 | 2,123 | 2,268 | ||
| Total financial liabilities | 6,852 | 8,456 | 7,612 | ||
Fair values – financial liabilities measured at amortized cost
Optomed considers that the carrying amounts of the financial liabilities measured at amortized cost substantially equal to their fair values.
Financial covenants
Optomed’s borrowings from financial institutions contain a financial covenant (equity ratio) and Optomed also has to meet certain key operative targets.
Optomed has to comply with the financial covenant terms specified in the loan agreement terms at the financial year-end. Equity ratio is calculated using the agreed formula. The table below summarizes the Group’s financial covenant term and compliance during the reporting period.
| Covenant term | Actual ratio | Applicable level | |
| Nordea loan | |||
| At June 30. 2023 | |||
| Equity ratio | 50% | 60.9% | Optomed Group |
| Cash amount | 2 million | 5.7 million | Optomed Group |
| At June 30. 2022 | |||
| Equity ratio | 50% | 61.5% | Optomed Group |
| Cash amount | 2 million | 7.1 million | Optomed Group |
| At December 31. 2022 | |||
| Equity ratio | 50% | 62.1% | Optomed Group |
| Cash amount | 2 million | 8.5 million | Optomed Group |
| OP loan equity ratio | |||
| At June 30, 2023 | 35% | 65.3% | Optomed Group |
| At June 30, 2022 | 35% | 62.7% | Optomed Group |
| At December 31, 2022 | 35% | 66.1% | Optomed Group |
Company’s Equity ratio is calculated as follows depending on the lender:
Nordea loan equity ratio calculation formula: Adjusted equity/(Balance sheet total+ Leasing liabilities)
OP loan equity ratio calculation formula: Adjusted equity/(Balance sheet total- received advances)
Optomed was in compliance with the covenant as at June 30, 2023.
Related party transactions
| In thousands of euro | Revenues | Trade receivables | Other expenses |
| Jan 1 – Jun 30 2023 | 0 | 0 | -40 |
| Jan 1 – Jun 30 2022 | 0 | 0 | -40 |
| Jan 1 – Dec 31 2022 | 0 | 0 | -80 |
*Comparison figures for Jan1-Jun 30 2022 numbers have been corrected in revenues and trade receivables category.
Revenue and trade receivables and some of the other expenses relate to the major shareholders of Optomed Ltd considered to be related parties to the parent company. Related parties: due to changes in the board of directors, the owners will no longer be related parties in 2022.
Other expenses consist of consulting fees paid to the Chairman of the Board of Directors.
Events after the review period
After the review period on 3 August 2023 Optomed announced that Juho Himberg will start as Optomed’s CEO 1 October 2023. Previously Juho Himberg has served as the CEO of Aidian (former Orion Diagnostica), a leading point-of-care diagnostics company with innovative products and services for improving the well-being and quality of life for people around the world. Prior to Aidian, Juho has held several leadership positions globally in healthcare and medical technology companies such as Orton, Stryker, C.R. Bard Inc. and Gambro. The CEO transition plan was announced 14 June 2023. Optomed’s current CEO Seppo Kopsala and the Board of Directors have agreed that Kopsala will leave the CEO position once the new CEO is ready to start.